

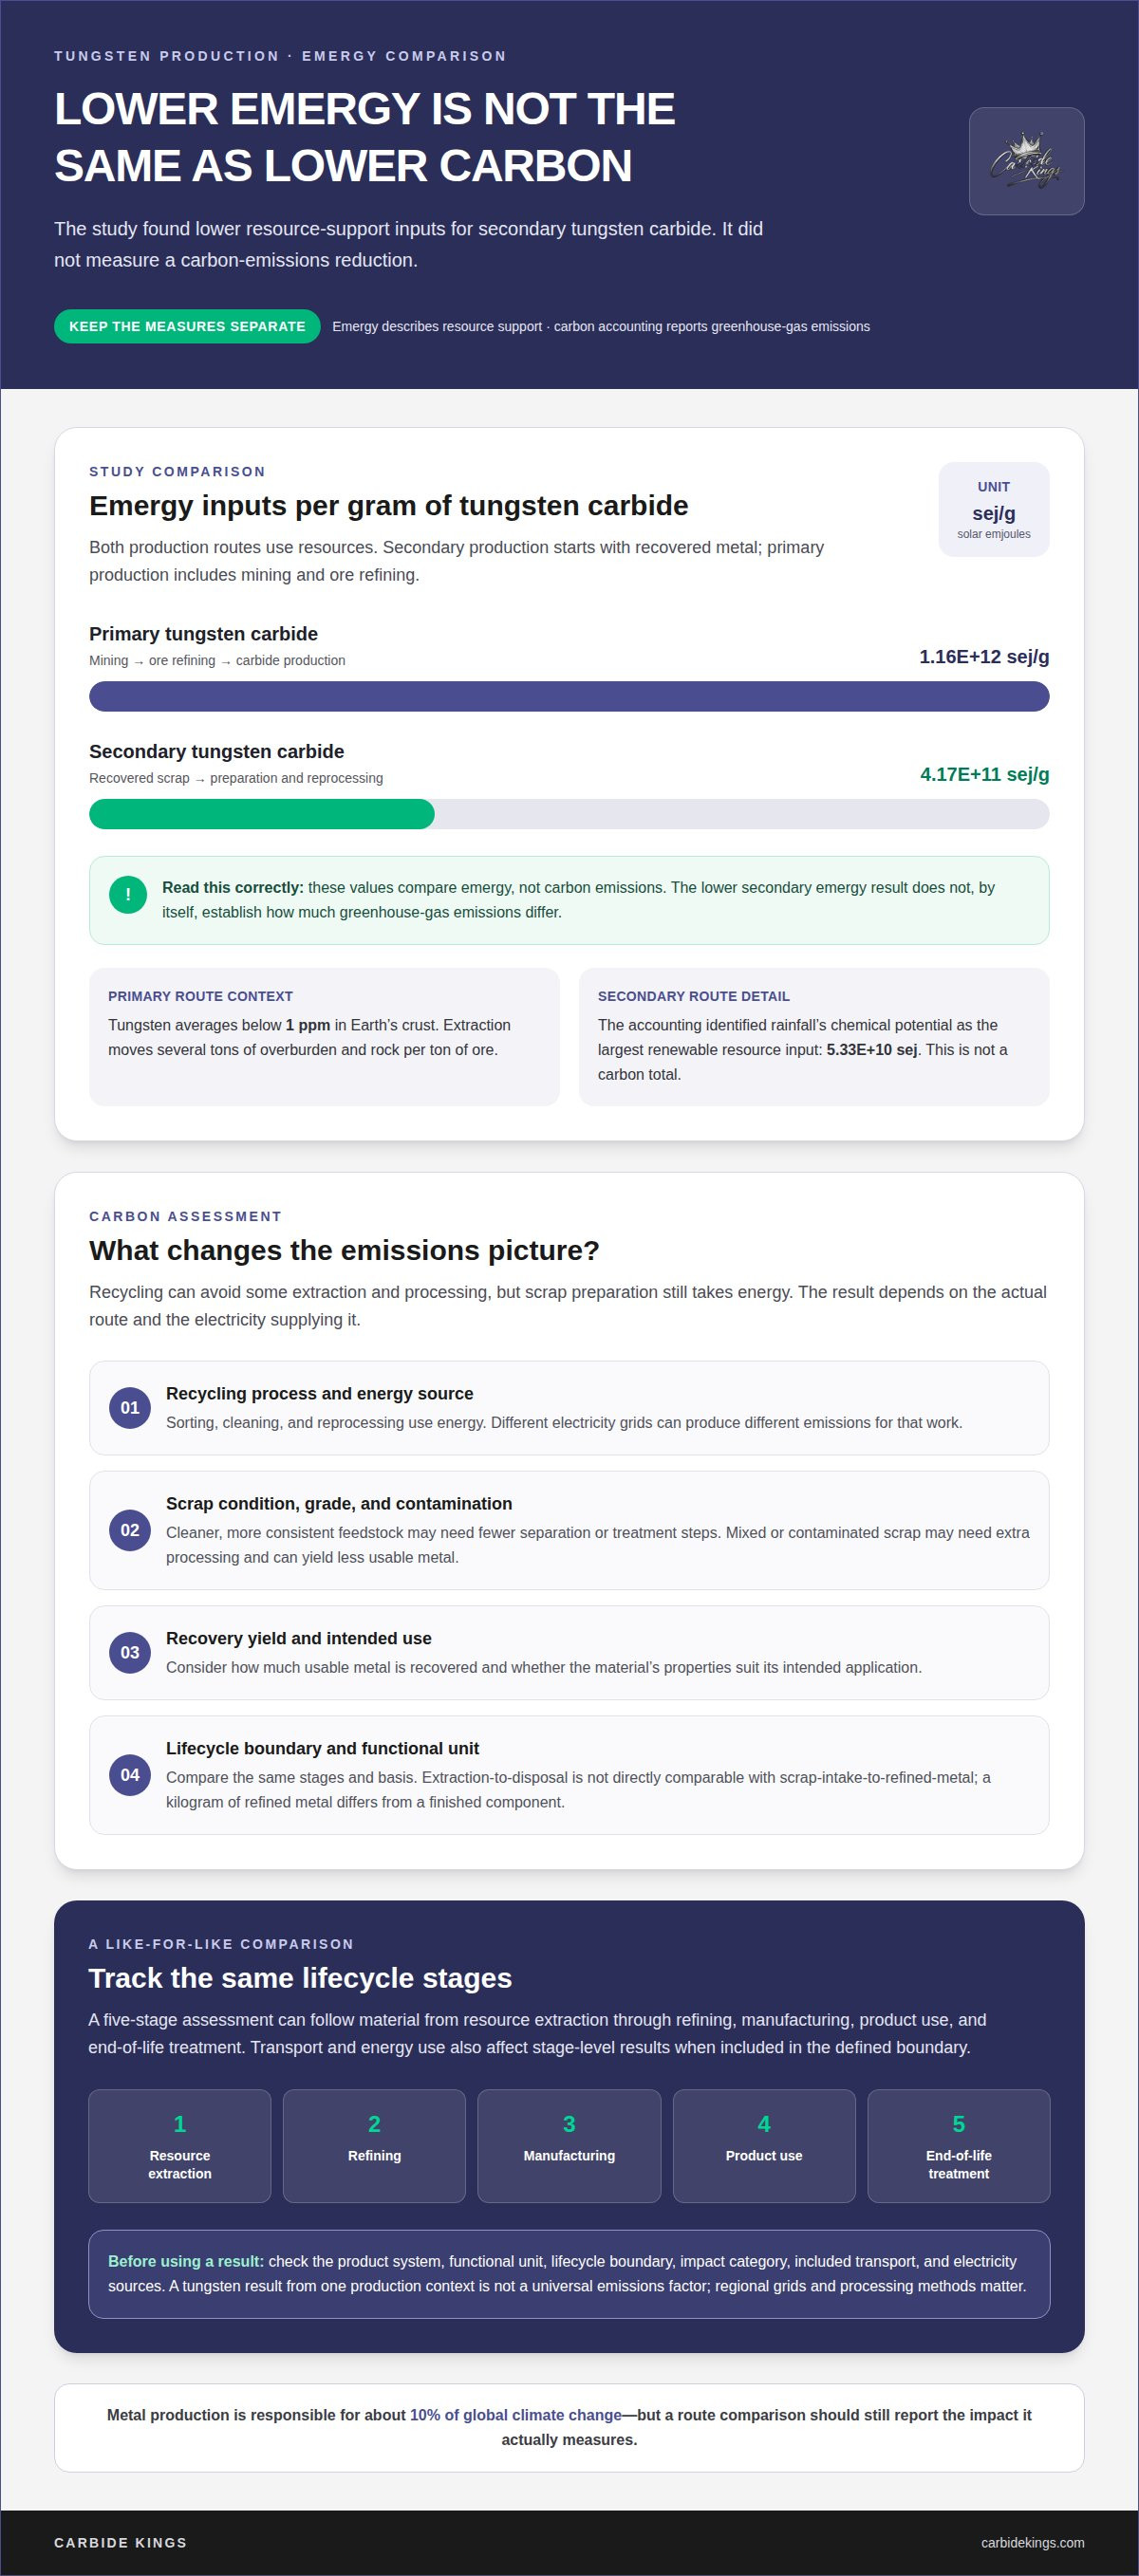
Secondary tungsten carbide production can use far less resource input than primary production, but that doesn’t make every carbon comparison straightforward. A comparison of primary and secondary tungsten carbide production suggests that secondary production may require fewer resources, but it does not by itself establish the difference in carbon emissions. Those figures measure emergy, not carbon emissions.
It makes sense to expect recycled metal to have a lower footprint: it avoids some of the extraction and processing required for virgin material. But scrap still takes energy to sort and process, and the electricity grid supplying that energy can change the emissions picture.
This article explains how production routes, recycling energy, lifecycle assessment boundaries, and regional electricity grids shape tungsten’s footprint. You’ll see what the available comparison tells you, where its limits lie, and which factors matter when evaluating secondary tungsten scrap alongside virgin metal.
Key Takeaways
- Separate emergy results from carbon emissions before comparing tungsten production routes; they measure different environmental impacts.
- Include scrap sorting and processing in the comparison, since recycling still uses energy and its impact depends on the production route.
- Set consistent lifecycle boundaries so extraction, processing, transport, and end-of-life stages are compared on the same basis.
- Account for the electricity grid supplying each production stage, then use the results to assess secondary tungsten scrap in its actual regional context.
Emergy analysis of primary and secondary tungsten carbide production
Ore refining starts with mining and processes tungsten-bearing ore into usable material; scrap recycling starts with recovered metal. Both routes require energy and resources, but their environmental inputs differ. The comparison below uses emergy, measured in solar emjoules, to assess the resource support required for tungsten carbide production.
Primary Tungsten Emergy Inputs
Emergy totals the resource inputs that support tungsten production, measured here in solar emjoules per gram. It helps compare environmental burdens beyond direct electricity use. In the production study, primary tungsten carbide required 1.16E+12 sej/g. Mining adds extraction and ore-refining demands before carbide production. Tungsten averages below 1 ppm in Earth’s crust, and extraction moves several tons of overburden and rock per ton of ore.
Secondary Tungsten Emergy Inputs
Secondary emergy counts resources used to recover and reprocess tungsten-bearing scrap into carbide. It matters because scrap avoids ore extraction, while processing inputs remain part of its environmental impact. The same study measured 4.17E+11 sej/g for secondary tungsten carbide production. Its accounting also identified rainfall’s chemical potential as the largest renewable resource input, at 5.33E+10 sej. This is a resource-accounting input, not a direct carbon-emissions total.
Production Routes and Environmental Impacts
Production routes determine which environmental impacts enter an assessment. Primary pathways include mining and refining before carbide manufacture; secondary pathways begin with scrap preparation and reuse. The studied secondary route had lower environmental loading than primary production. Metal production is responsible for about 10% of global climate change, making route selection relevant to broader environmental assessments.
Keep the functional unit and system boundary consistent when comparing production routes. Emergy measures resource support; carbon accounting reports greenhouse-gas emissions. Treat these measures separately so a lower emergy result is not presented as a measured reduction in carbon emissions.
Recycled metal energy use and carbon savings
Recycling metal generally requires considerably less energy than extracting it from ore. The advantage depends on the scrap’s preparation and processing route. A fair comparison includes the energy used to sort, clean, and reprocess material, not just the final manufacturing stage.
In the United States, requirements for tungsten scrap, transport, and residues depend on how the material and any residue are classified. Classification, contamination, and shipment details determine which applicable waste and transport requirements apply.
There is no single carbon footprint per kilogram for secondary tungsten scrap. Emissions depend on the recycling process, its energy sources, the scrap’s condition, and recovery yield. The electricity mix also matters: processing powered by different grids can produce different emissions.
Grade and contamination affect the processing needed before scrap can return to production. Cleaner, more consistent feedstock may require fewer separation or treatment steps, while mixed or contaminated material may need additional processing. These steps use energy and can reduce the amount of usable metal recovered.
Recycled metal can retain the properties of metal made from raw material extraction while requiring much less energy input. Manufacturers should consider both whether the recovered material suits its intended use and how much energy is needed to prepare it. Manufacturing scrap is recovered through recycling operations at metalworking facilities.
The tungsten comparison discussed earlier reflects one production context, not every recycling route or electricity supply. Its findings should not be treated as a direct U.S. emissions factor. For U.S. operations, local electricity sources and processing methods shape the emissions estimate.
Aluminium offers a separate illustration, not a tungsten-specific estimate. Recycling aluminium uses 5% of the energy required for virgin production, a 95% reduction, and recycling one tonne saves approximately 11.4 tonnes of CO2. These figures show why material-specific data matters.
For a practical material option, explore tungsten scrap materials for manufacturing and metalworking needs.
Life cycle assessment and carbon footprint uses of metals data
A metal life cycle assessment tracks environmental effects across defined stages, rather than counting production alone. For tungsten, consistent boundaries help distinguish extraction, refining, manufacturing, use, and end-of-life impacts.
Stages of Metals Life Cycle Assessment
A five-stage assessment can track material from resource extraction through refining, manufacturing, product use, and end-of-life treatment. Each stage captures different inputs and emissions. For example, ore extraction and scrap processing belong to different production routes. Including both within the same boundary helps readers compare like with like.
Transport and energy use can also affect stage-level results when included in the assessment boundary. A tungsten product assessed from ore extraction to disposal may not be directly comparable with one measured only from scrap intake to refined metal. Check which stages are counted before using a result for procurement or reporting.
Life Cycle Assessment Methodology
Life cycle assessment methodology defines the product system, functional unit, boundary, and impact categories before data is collected. These choices determine what a result represents. A comparison per kilogram of refined metal answers a different question from one per finished component, because component performance and service life affect the basis.
Inventory data records material, energy, and emissions across the included processes. Impact assessment translates those inputs into categories such as climate change. Use the same method and unit for primary and secondary routes; otherwise, apparent differences may reflect study design rather than production performance.
Metal datasets support procurement, manufacturing decisions, and environmental reporting, but a figure only applies within its stated scope. One comparative life cycle scorecard assigns metal from ore a score of 15 and recycled metal a score of 12, with lower scores indicating better performance. This is a scorecard result, not a carbon footprint per kilogram.
Use lifecycle data to identify which stages drive impacts, then compare alternatives using matching boundaries and impact measures. For tungsten, keeping emergy results separate from carbon emissions prevents one environmental indicator from being mistaken for another. A clear method makes the comparison useful for decisions.
Regional electricity-grid effects on emissions
Electricity affects emissions wherever a tungsten production route uses powered equipment. The grid supplying a facility determines which generation sources contribute to its electricity-related footprint. Identical processing equipment can produce different reported emissions in different locations if their electricity sources differ. The carbon result changes even when scrap grade, machinery, and output stay the same.
Separate electricity use from direct fuel use in the assessment. Mining and ore extraction may involve fuel-powered equipment, while refining and scrap processing can use grid electricity or on-site energy. Record each source against the process it serves. This breakdown shows whether emissions come mainly from extraction, thermal operations, or electricity-dependent processing.
Regional comparisons also depend on where each production stage occurs. A U.S. facility may process scrap using its local grid, while upstream material production takes place elsewhere. Applying one regional electricity profile to the entire supply chain can misrepresent individual stages. Track the locations of extraction, refining, transport, and recycling, then match each energy input to its location.
Grid conditions can change over time as electricity sources shift. An assessment should identify the period represented by its electricity data and apply consistent assumptions to primary and secondary routes. Comparing one route using current grid data with another using older data can obscure the effect of recycling itself. Keep the boundary, time period, and treatment of energy sources aligned.
For a practical comparison, separate process efficiency from grid-related emissions. This helps identify whether a lower footprint comes from using less energy, cleaner electricity, or both. Review your tungsten scrap stream as part of that assessment, alongside the electricity sources supporting its processing.
Carbide Kings
Carbide Kings supplies industrial tungsten and carbide scrap materials for manufacturing and metallurgical use. If your lifecycle assessment points toward evaluating secondary inputs, Carbide Kings offers Tungsten Hard Scrap, Tungsten Soft Scrap, Carbide scrap, and Tungsten Alloys. These materials give manufacturers options to consider alongside virgin feedstock, while the footprint comparison should still reflect the actual processing route, electricity sources, and assessment boundaries.
Turn to Carbide Kings when sourcing these scrap materials is the practical next step in your production planning. Lifecycle data frames the environmental comparison; material selection connects that analysis to procurement. Contact Carbide Kings to discuss scrap materials for industrial use.
Turn lifecycle insight into a sourcing decision
Your next decision can turn assessment into procurement planning. Use a lifecycle assessment comparing the virgin metal carbon footprint with secondary tungsten scrap to frame material choices for your manufacturing needs. Then match those choices to the scrap stream and the role it will serve in your operation. Connect environmental priorities with material requirements rather than relying on a standalone emissions figure.
Before adjusting purchasing plans, define the evidence your team will use, including the production route, assessment boundary, electricity assumptions, and functional unit. Applying consistent criteria makes future material comparisons easier to interpret and discuss across procurement and manufacturing teams.
Carbide Kings offers Tungsten Hard Scrap, Tungsten Soft Scrap, and Carbide scrap for industrial use. These materials can give your sourcing discussion a concrete starting point as you consider secondary inputs. Have a tungsten sourcing question? Contact Carbide Kings to discuss your needs and move forward with clarity.
Frequently Asked Questions
What is the cradle-to-gate carbon footprint of virgin tungsten metal per kg?
The cradle-to-gate footprint per kilogram depends on the production route, included processes, and electricity sources. Ore extraction, refining, and manufacturing can all affect the result. A useful figure must state where the assessment begins and ends and what energy data it uses. Compare only values calculated using the same product basis and boundaries, rather than treating any figure as universal.
What lifecycle assessment studies compare primary and recycled tungsten production?
The comparison discussed here examined primary and secondary tungsten carbide production at a firm in Ganzhou, Jiangxi province, China. It used emergy accounting and compared environmental loading, so its results describe resource inputs rather than a direct carbon footprint per kilogram. This distinction matters: the study informs comparisons between production routes, but does not by itself provide a cradle-to-gate greenhouse-gas value.
Which lifecycle stages are included in tungsten carbon footprint estimates?
A tungsten estimate can cover resource extraction, refining, manufacturing, product use, and end-of-life treatment. A cradle-to-gate study stops before product use and disposal, while a full-life-cycle comparison can include them. Transport may also be counted, depending on the boundary. For example, comparing scrap at the recycling facility with virgin metal at the factory gate can omit different upstream stages.
How does electricity mix change the carbon footprint of virgin and recycled tungsten?
The electricity mix changes emissions from electricity-consuming steps, such as refining or scrap processing. The same process can therefore have different electricity-related emissions in locations supplied by different generation sources. For a fair comparison, match each production stage to the grid supplying it. Keep direct fuel use separate too, since extraction equipment and grid-powered processing draw on different energy sources.
What are the environmental trade-offs of tungsten recycling beyond greenhouse gas emissions?
Recycling can reduce demand for ore extraction, but it still requires sorting and processing. These steps use resources and energy, and the route’s overall environmental impact depends on the material handled and the treatment required. Mining also disturbs land and moves overburden and rock. Assessing both routes across multiple impact categories gives a broader view than comparing greenhouse-gas emissions alone.


